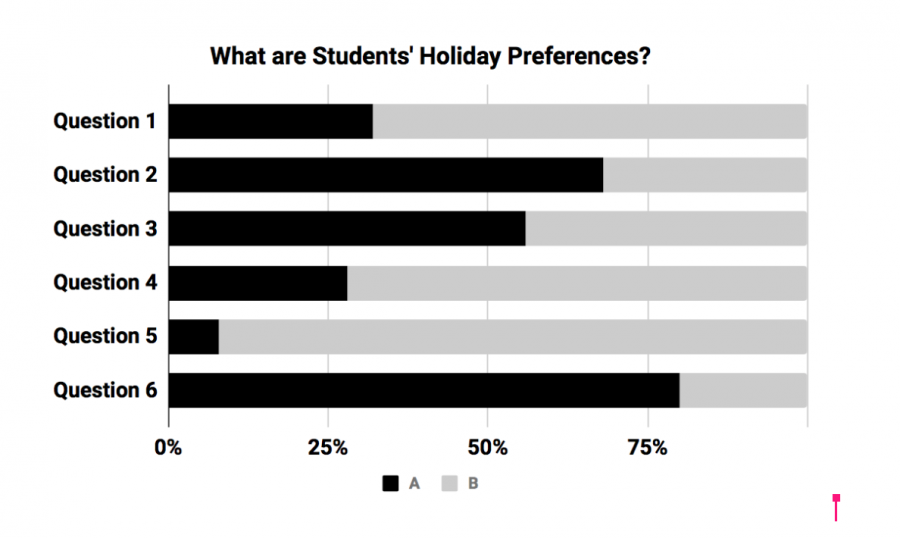
What are Students’ Holiday Preferences?
- Would you rather give or get gifts?
A. Give
B. Get
Give because…“I love seeing other people being happy and me being able to contribute to that.”
Get because…“Vbucks only.”
- Would you rather decorate a Christmas Tree with just lights or just ornaments?
A. Lights
B. Ornaments
Lights because…“Shine bright like a diamond…yuh.”
Ornaments because…“They have more sentimental value.”
- Which song would you rather listen to on repeat for an entire day straight?
A. All I Want for Christmas is You
B. Walking in a Winter Wonderland
All I want for Christmas is You even though …“ I’d literally rather die.”
Walking in a Winter Wonderland but… “I’d prefer Mo Bamba instead.”
- Which holiday movie do you prefer?
A. The Grinch
B. Home Alone
Neither because…“What about Bad Santa 3?”
The Grinch because…“He is my spirit animal.”
- Would you rather have a holiday without snow or with snow?
A. Without Snow
B. With Snow
Without snow because…“I’d rather be on a beach in Miami.”
With snow because…“White Christmas is the best Christmas.”
- Would you rather have a cup of hot chocolate or eggnog?
A. Hot Chocolate
B. Eggnog
Hot Chocolate because…“Eggnog makes me want to vomit.”
Eggnog because… “It’s milk x 2.”
Analysis of Mendham Results vs Buzzfeed Results
How do Mendham students celebrate the holidays? Are we any different from the general public? Both Mendham High School students and Buzzfeed’s Online viewers completed a Holiday Would You Rather Quiz to find the answers to these questions. The survey of students at Mendham had a question that differed from that of BuzzFeed; students were asked if students preferred “All I Want for Christmas is You” or “Walking in a Winter Wonderland” and BuzzFeed asked about “All I Want for Christmas is You” or “Santa Claus is Comin’ to Town”. The results of the Mendham students showed “All I Want for Christmas is You” was favored by fifty-six percent and the BuzzFeed results favored “All I Want For Christmas is You” by seventy-five percent. The results of the survey at Mendham demonstrated fairly similar to BuzzFeed when asked about whether they preferred a holiday with or without snow, their opinions on holiday drinks, and how they would rather decorate a Christmas tree. Eight percent of those surveyed at the high school preferred a holiday without snow and of those surveyed by BuzzFeed eleven percent preferred a holiday without snow. Eighty percent of the Mendham students preferred hot chocolate to eggnog and eighty-nine percent of the participants on BuzzFeed shared this preference. Finally, sixty-eight percent of Mendham students and fifty-nine percent of BuzzFeed participants would choose to decorate a tree with only lights. However, the results differed to a larger extent on the question about giving versus getting gifts. Thirty-two percent of the surveyed Mendham students prefer giving gifts over getting gifts, however, the results from the Buzzfeed Quiz were different. 41.5K or fifty percent of those answering this question on BuzzFeed chose giving gifts. This is an eye-opening piece of data because it reflects on Mendham culture and their customs. As whole though, results from both quizzes share similar results on their preferences during the holiday season.

Carleigh DeCamp is currently a senior at Mendham HS. I is a member of FBLA, Relay for Life and is president of Friends & Buddies. Carleigh has always had...

Grace Hassell is a senior at West Morris Mendham High School. She is captain and plays first doubles on the high school's Varsity tennis team. Grace is...

Chloe Williams is 17 years old and a Senior at West Morris Mendham High School. Chloe considers myself to be very outgoing, confident, selfless and affectionate....